
I’ve just finished listening to the California Assembly hearing, which in part discussed the OIG report about the botched transfer to San Quentin. Most of the attention focused on this part, as CCHCS Receiver Clark Kelso (depicted above) blamed San Quentin officials for their part in causing the outbreak (seeing Quentin and CCHCS blame each other is like watching an elegant train wreck.) No satisfying response was given to the question how we can prevent such situations in the future–or at least not ostensibly, unless one listened very carefully to the beginning of the hearing.
In the first part of the hearing, CDCR Secretary Kathleen Allison discussed budgetary aspects of CDCR management in the coming year–particularly the impending closure/transformation of at least two prisons: CCWF and DVI. She also commented on population fluctuations, focusing on population reduction (“lowest levels in 30 years”) and on the bottleneck at the jails.

Because some alert activists noted a recent rise in population at Wasco, we decided to check whether there was a bigger trend here. Chad Goerzen ran the numbers, and what we found may suggest that the mistakes that were made at Quentin are still being made–resulting in increased infections.
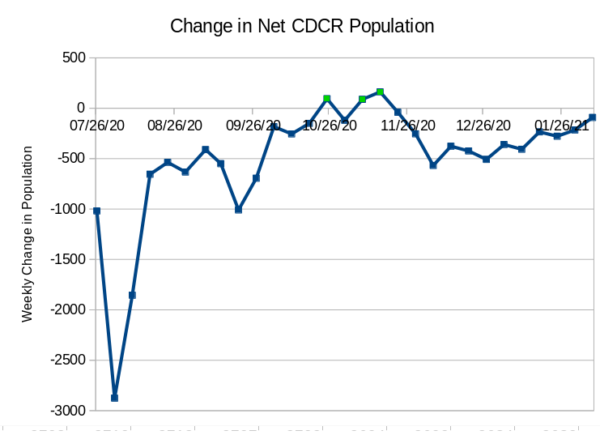
First, it wasn’t just Wasco. The graph below shows the change in net CDCR population in the last six months or so. As you can see, between mid-October and late November, CDCR population actually increased.
Between October 4 and November 29, 13 prisons showed a net population increase:
SAC (+3)
CAL (+89)
CEN (+22)
CCWF (+63)
HDSP (+2)
KVSP (+139)
MCSP (+126)
NKSP (+187)
RJD (+41)
SVSP (+63)
SCC (+64)
VSP (+22)
WSP (+749)
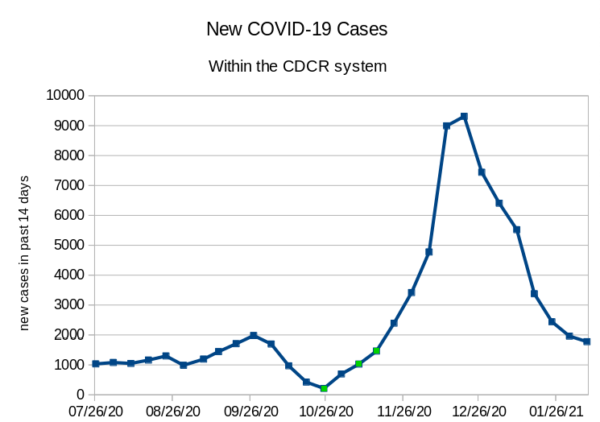
Now, recall the serious outbreaks that characterized the fall and winter at CDCR. Without contact tracing, of course, we can’t show that these transfers caused the outbreaks. But here’s what we can tell. The green dots mark the period during which the prison population overall increased:
Now, a granular analysis of outbreaks for individual institutions. By December 7, 2020, the following prisons had major outbreaks of more than 50:
CCI (92)
LAC (795)
SAC (115)
CAC (367)
CAL (154)
CEN (419)
CTF (799)
HDSP (722)
ISP (120)
KVSP (505)
MCSP (733)
NKSP (208)
PBSP (51)
PVSP (1213)
RJD (400)
SVSP (83)
SCC (248)
SATF (593)
VSP (368)
WSP (336)
The prisons in bold are the ones that had increases in population. In total, 12 of the 13 prisons with population increases suffered major outbreaks by 12/07/20. Furthermore, these make up 12 of the 20 major outbreaks within CDCR at that time. The only prison that did not evince a new outbreak after a population increase was CCWF, which was just at the tail end of a major outbreak at the time (and possibly experiencing some form of herd immunity.)
Where did the new population come from? We don’t know. What we do know is what Sheriff Growdon of Lassen County said at the CCC conference last Friday: that the population bottleneck at the jails due to the transfer stoppages has caused outbreaks at the jails; that it is incredibly difficult to recruit qualified medical staff in jails located in rural areas; and that educating guards about masking, testing, and vaccinating has been an uphill battle, to the point that he was considering rewarding them financially for COVID compliance. Could an accumulation of these local problems at the county level account for the population rise in the fall and, subsequently, for the outbreaks? We cannot prove this beyond doubt, but we can raise concerns.


No comment yet, add your voice below!